
The NHL trade deadline was on February 25. Since then, the Washington Capitals have won seven of eight games, taken hold of the Metropolitan Division lead, and generally looked awesome. The last few weeks have been a dramatic shift from earlier in the season, when the Caps looked just sorta okay. Something has changed.
There has been an awakening. Have you felt it?
Here are color-coded, full-season numbers for NHL teams at five-on-five. Green means good.

A glossary:
- CF: How many shots Washington attempts per hour.
- CA: How many shots Washington’s opponents attempt per hour.
- CF%: The share of total shot attempts belonging to Washington.
- SCF: How many scoring chances Washington takes per hour.
- SCA: How many scoring chances Washington’s opponents take per hour.
- SCF%: The share of total scoring chances belonging to Washington.
- HDCF: How many high-danger chances Washington takes per hour.
- HDCA: How many high-danger chances Washington’s opponents take per hour.
- HDCF%: The share of total high-danger chances belonging to Washington.
- GF: How many goals Washington scores per hour.
- GA: How many goals Washington’s opponents score per hour.
- GF%: The share of total goals belonging to Washington.
Over the whole of the season, the Washington Capitals have not been impressive at 5-on-5 play. You’ll find them in the middle of the table, mediocre at controlling overall play, but markedly worse at the subset of attempts that are considered high-danger chances (45.6 percent). Excellent shooting percentages (10.2, highest in the NHL) have kept Washington in the black overall, but the team has had problems — particularly on the defensive side of the puck, where the team allows opponents among the highest rates of dangerous chances in the league.
That data was from the whole season. Now here’s the same table, but just since the trade deadline.

Since the trade deadline, Washington has controlled play more than any team in the NHL. That dominance persists when using scoring chances and stays near the top using high-danger chances. That possession is how the team has won all but one game since February 25 — most of them in convincing fashion, owning the puck often even when leading late in games.
To try to figure out what’s changed, I’ve gathered data from Natural Stat Trick that shows how various forward/defenders perform when on the ice together. We’ve done this exercise before a bunch of times on RMNB, but here’s a quick crash course:
- Forwards are along the left.
- Defenders are along the top.
- Players are ordered by their average ice time.
- The number where two players intersect is their stat when those two players are on the ice together.
- Combinations that don’t have enough ice time together are grayed out.
- Each stat is color-coded: green is good, red is bad.
In general you want to see most green at top left because that represents more of a team’s ice time. The distinctions this time around are the new players, whose numbers could be seen as a proxy for post-deadline play.
First up: shot-attempt percentage.

To the surprise of no one, adding Carl Hagelin and Nick Jensen has been transformative for the Capitals. Hagelin has helped the struggling Orlov – Niskaken pairing tilt the ice the right way, and Jensen has made the Caps’ best line (Backstrom’s) into one of the best in the entire league over the last couple weeks.
This visualization also reminds us that the top line (Ovechkin – Kuznetsov – Wilson) has done poorly with their most common defensive pair, Orlov – Niskanen. This is the intersection of a few points I made prior to the deadline about Washington’s biggest weaknesses down the stretch, but there is reason for optimism. As this HockeyViz chart shows, ice time among all four defenseman have trended down as the team has improved its bottom-pairing talent.

I hope we see even more balanced minutes as Jensen establishes himself.
Even if that happens, there remains the problem of Washington’s best forward line being bad defensively. We’ll see that illustrated better in a moment, but first let’s look at how many scoring chances the Caps generate per hour.

This is counterintuitive. Despite having elite shooting talent and scoring a lot, the Capitals don’t actually generate a lot of scoring chances. There are exceptions though — especially when John Carlson is on the ice. Carlson increases the pace and danger of play in both directions (as you’ll see below), which is maybe a fine tradeoff as long as you’ve got good goaltending and great shooters.
Meanwhile, Nick Jensen‘s impact doesn’t seem very acute on offense, which makes sense considering his role as a defense-first defender, though I expect his offensive numbers to improve as his ice time does.
Now to defense, measured in Washington’s opponents’ scoring-chance rates. In this case, lower is better.

Here you see the other side of Carlson’s impact. Opponents go wild against him, especially when he’s on the ice with Evgeny Kuznetsov, another player with severe defensive deficiencies. Those are some especially scary shifts and they remain the single biggest problem Washington needs to work on as they gear up for the postseason.
But on the plus side, we’ve got more proof that Backstrom and TJ Oshie are having solid defensive seasons. And we can plainly see Carl Hagelin helping his teammates’ shot suppression massively. That’s what Washington needed, and now they’ve got it.
We’ll conclude where we began: with an appreciation of how Washington has improved. You can see it below. The line is the difference in shot attempts between the Caps and their opponents. Game 62 was the first after the deadline.
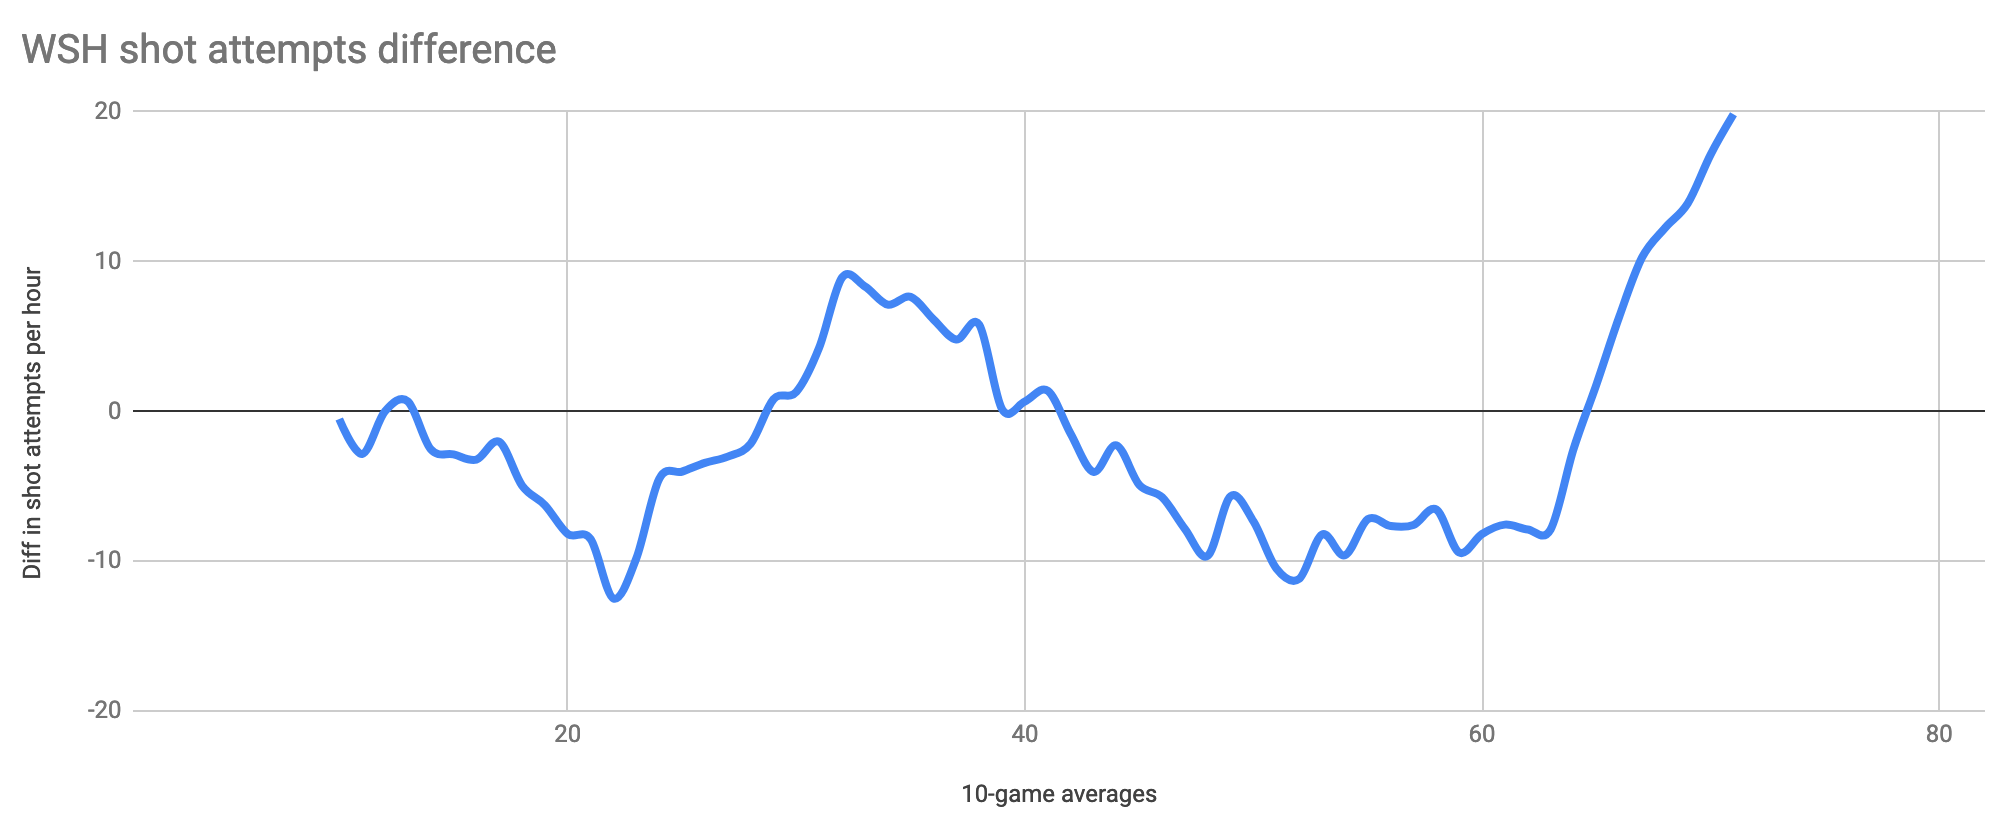
We see the same effect when using expected goals from Evolving Hockey. It’s quantity and quality.

The addition of Hagelin and Jensen was a profound inflection point for the Caps, allowing them to climb from a decent team with risky underlying patterns to a genuinely fearsome team.
But exactly how fearsome remains an open question. Washington’s recent run of games included the Senators, Rangers, Flyers, and Devils — four teams that have not been good. That changes now. Starting tonight and until the end of the regular-season campaign, the Caps will face their toughest competition of the entire season, including two games against Carolina and three against Tampa.

We’re about to find out who the 2018-19 Capitals really are. I’m ready.
This story would not be possible without Natural Stat Trick, HockeyViz, and Evolving Hockey. Please consider joining RMNB in supporting them on Patreon.

