This is my final solo snapshot of the season. My first and most sophisticated thoughts about the 2016-17 so far goes like this:
The Caps have dominated the regular season. With 100 points and a plus-69 goal differential, the team has already locked up a playoff appearance. The remaining questions are few:
- Can they win the division and the Presidents’ Trophy?
- Should they make any tweaks down the stretch?
- How great is Braden Holtby?
I think the answers to one and two are yes. The answer to three is back-to-back Vezina good. But I wonder sometimes if Holtby’s excellence might be lulling the Caps into complacency. The team is not without weaknesses, and I’d rather see them addressed now than in an offseason that comes too soon.
Let’s do the snapshot.
Forwards
| Player | GP | TOI | SA% | Rel SA% | GF% | PDO |
|---|---|---|---|---|---|---|
| Burakovsky | 53 | 603 | 56.6 | +4.9 | 67.7 | 104.4 |
| Eller | 70 | 770 | 56.4 | +4.6 | 67.2 | 103.4 |
| Williams | 70 | 865 | 55.8 | +3.9 | 60.6 | 101.6 |
| Connolly | 57 | 573 | 55.1 | +2.6 | 75.8 | 106.4 |
| Johansson | 71 | 937 | 54.4 | +2.1 | 63.0 | 103.3 |
| Vrana | 21 | 190 | 54.3 | +1.4 | 64.1 | 102.1 |
| Kuznetsov | 71 | 957 | 53.6 | +1.0 | 61.9 | 103.5 |
| Oshie | 58 | 749 | 53.0 | +0.1 | 65.7 | 105.3 |
| Backstrom | 71 | 946 | 51.7 | -1.7 | 62.0 | 103.8 |
| Ovechkin | 71 | 970 | 51.1 | -2.7 | 59.4 | 103.5 |
| Wilson | 71 | 726 | 51.0 | -2.3 | 61.4 | 103.6 |
| Winnik | 61 | 597 | 50.3 | -2.9 | 65.1 | 104.3 |
| Beagle | 70 | 700 | 47.3 | -7.1 | 64.3 | 105.4 |
Defense
| Player | GP | TOI | SA% | Rel SA% | GF% | PDO |
|---|---|---|---|---|---|---|
| Niskanen | 68 | 1106 | 55.5 | +3.6 | 62.8 | 102.7 |
| Schmidt | 56 | 785 | 55.0 | +2.7 | 63.8 | 103.6 |
| Orlov | 71 | 1207 | 54.9 | +3.2 | 63.7 | 103.5 |
| Orpik | 68 | 990 | 54.1 | +1.7 | 68.0 | 104.8 |
| Shattenkirk | 69 | 119 | 52.7 | -1.2 | 49.7 | 99.4 |
| Carlson | 65 | 1026 | 50.9 | -3.6 | 59.2 | 103.1 |
| Alzner | 71 | 1124 | 48.8 | -6.2 | 61.7 | 104.3 |
| Chorney | 17 | 222 | 45.9 | -5.7 | 71.8 | 108.6 |
Observations
- With the return of Andre Burakovsky to active service, Jakub Vrana was re-assigned to Hershey this week. Vrana had a great medium-term showing in the bigs, though he dropped from an amazing 59.1 shot-attempt percentage (SA%) to a still great 54.3 since the last sample. He’ll be back, and he’ll be good.
- The crucial point is that Burakovsky’s back, and thank goodness. As we’ll revisit below, Barry Trotz has really come around to appreciate his younger talent this season. Burakovsky’s numbers are sterling with his third line (61.3 SA% when together with an even higher share of scoring chances). The TOI allocation compared to the Beagle line is still a travesty, but I think Trotz realizes what he has in Burakovsky. This line could be crucial in the postseason.
- I’ve highlighted every single player’s goals-for percentage. Every one of them is in or near the 60s. No one is even close to being outscored during 5-on-5. That’s astonishing. It’s a credit both the team’s offensive prowess and the continued dominance of Braden Holtby. But I wonder if that success has discouraged Trotz from making adjustments — like giving more ice to the third line, adjusting defensive-zone start personnel, or making a simple tweak to the top six.
- The top line of Alex Ovechkin, TJ Oshie, and Nick Backstrom are low in the stack of forwards when ranked by possession. That’s unfortunate. The Caps are not fully exploiting the league’s most dangerous forward, and they’re giving up way too many scoring chances (8.9 every hour). Trotz could get even more out of his top six just by swapping the centers. I guess the “if it’s not broke, don’t fix it” principle is at play here, and there’s no incentive to make adjustments right now. I worry that might burn the team once the top line has the same matchup for seven games in a row after game 82.
- When Karl Alzner and Jay Beagle play together, the Caps take just 41.6 percent of the shot attempts (not weighted by score or venue). That’s a brutal number, even considering their defensive deployments. Jay Beagle wins 56 percent of his faceoffs, but that still means 44 percent of the time that he and Alzner are on the ice for a defensive-zone draw, the Caps are about to get shelled.
- Kevin Shattenkirk is boss. He and Brooks Orpik are enjoying 56 percent of the shot attempts (unadjusted) when playing together, which is about what Orpik gets with Nate Schmidt, hallowed be thy name. I’ve heard some talk of Shattenkirk not “fitting in” or disrupting the chemistry. I haven’t seen it. Plus, the Ovi Shot from the Ovi Spot™ looks damn fine when Shat’s making the pass.
- The other big win for Barry Trotz this season is trusting Dmitry Orlov. Orlov’s TOI has increased by four minutes per game. Orlov has repaid that trust with his best season to date. Considering he missed all of 2014-15 to injury and got buried last season, Orlov’s success in 2015-16 is all the most impressive. He leads the Caps in 5-on-5 ice time.

- To wrap up, I asked Twitter for any questions would like to see addressed in this snapshot. A couple of them I will mine for stories next week, but here are some quick hits.
@peterhassett Tom Wilson. Seems he is driving the net hard these days but are his scoring chance numbers actually good/improving?
— Ben Reed (@DontStopBreedin) March 19, 2017
- My goodness, yes! Compared to the rest of the forwards, Tom Wilson has not been a particularly strong net-crasher in the past, but since the end of February he’s been wilding out. His time spent on the top line certainly helped, but I think Wilson should individually be praised for creating chances. Via Corsica, here’s Wilson compared to wingers on the other lines, including Washington’s two best crashers, Williams and Oshie. By rate, Wilson has out-chanced them this month.

@peterhassett @russianmachine How much is Justin Williams hurting the second line with his recent play?
— Jon Goss (@SpinDoctor_) March 19, 2017
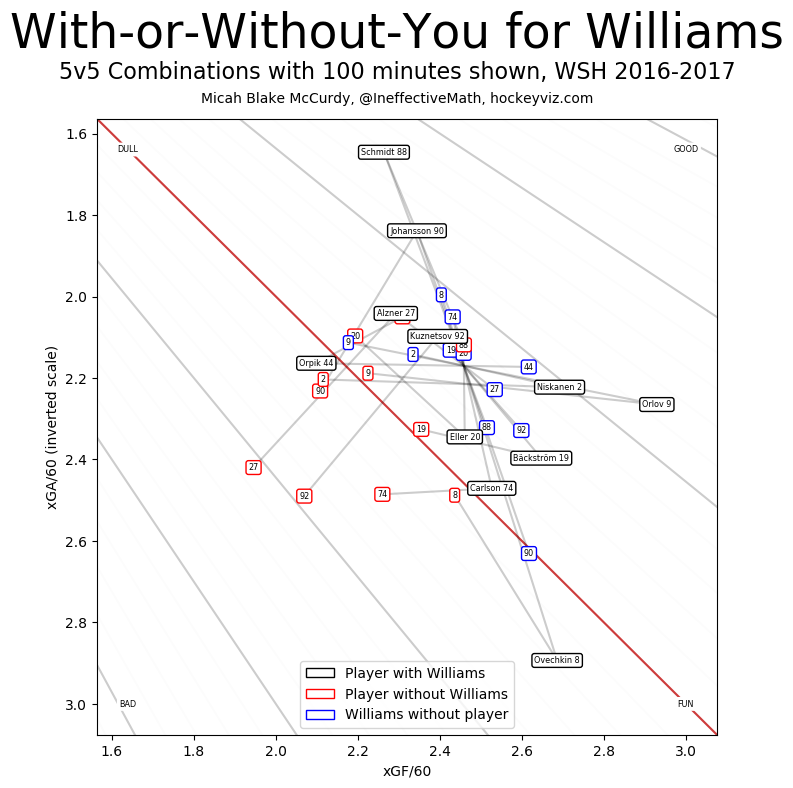
- Not at bit. At age 35, Justin Williams is certainly near the end of his usefulness, but he’s been remarkably good and reliable in his top-six role. He’s not generating chances (see the graph with Wilson above) like he did in late 2016, but I haven’t noticed any drop-off in his overall play. Williams’ game is a bit understated, and unfortunately maybe that’s also made him underrated. But to be clear: he’s fantastic. Here’s his with-or-without-you graph to show how he makes pretty much everyone better. You can see the whole thing at hockeyviz.com.

@peterhassett why were you so wrong about Oshie last season?
— Pat Holden (@pfholden) March 19, 2017
- I made two fatal errors in the bet: failing to include the playoffs in the terms, and failing to extend it to this season. I think, in principle, I have been wholly vindicated by the bet, as I correctly predicted that TJ Oshie‘s offense would skyrocket in Washington. I didn’t predict, however, that Oshie would lead the league with a bonkers 24.2 shooting percentage. He’s scoring on a quarter of his shots in a league where the best players score on half that. By the way, re-signing Oshie would be a huge mistake. The Caps would be paying out the ear for a performance that he cannot sustain, and forgoing an explosion of younger, cheaper talent in the process. But you already knew that, Pat.
Glossary
- GP. Games played.
- TOI. Time on ice. The amount of time that player played during 5v5.
- SA%. Shot-attempt percentage, a measurement for puck possession. The share of shot attempts that the player’s team got while he was on the ice.
- Rel SA%. The percentage difference of shot attempts the Caps had when the player on the ice as opposed to when the player is on the bench.
- GF%. Goals-for percentage. The share of goals that the player’s team got while he was on the ice.
- PDO. (A meaningless acronym.) The sum of the player’s on-ice shooting percentage and his goalies’ on-ice save percentage. Above 100 means the player is getting fortunate results that may be reflected in goal%.
All stats from Corsica unless otherwise noted or linked
Headline photo: Scott Audette


