

Editor’s note: Pat Holden has written about Caps hockey over at Brooks Laichyear since 2012. We’ve asked him to pitch in here at RMNB to smarten us up a bit. Please give Pat a warm welcome. Follow him on Twitter.
This isn’t a post about plus-minus or debating its merits. I don’t like it and neither should you, but that’s not my purpose here. You can love plus-minus and still read this post without becoming enraged. Probably.
Jeff Schultz‘s plus-50 in 2009-10 was the highest rating we’ve seen since Peter Forsberg in 2003. When Caps fans or hockey fans in general make fun of plus-minus, Schultz’s name is almost always invoked. Even Ovechkin did it.
But we don’t often look too closely at Schultz’s 2009-10 season. It was uncommon and– most importantly– really, really lucky. Below is a player usage chart for the Caps defense from that season that will serve as the foundation for examining Schultz’s season.
First, a quick explanation of player usage charts.
Player usage charts were created by Rob Vollman, he of Hockey Abstract fame. I got the chart from War on Ice. A quick explanation of the charts:
- The x-axis measures Offensive Zone Start %, or ZS%, which is the percentage of shifts a player starts in the offensive zone. The further to the left a player is, the “tougher” (more D-zone starts) his minutes are thought to be.
- The y-axis measures Time On Ice Competition %, or QOC TOI%. This is used to gauge how tough the competition is that a particular player skates against. The higher the position on the y-axis, the tougher competition a player is facing.
- The shade of the bubble measures Corsi Relative%, or CorsiRel, which is basically just a different way of representing SA% in Peter’s weekly snapshots. With 0 as the starting point, a positive percentage (in blue) indicates a player’s team does that much better with him on the ice in regards to shot attempts, whereas a negative percentage (in red) indicates his team does that much worse with him on the ice, as opposed to when he’s off.
- The size of the bubble is the amount of ice time a player gets relative to the other players on the chart.
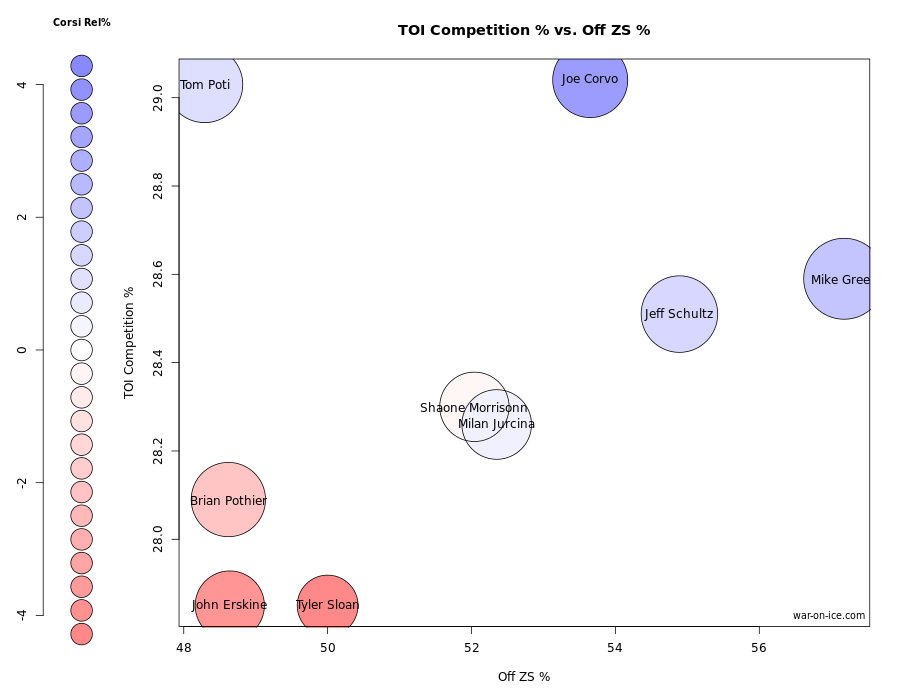
The usage chart reflects 5-on-5 numbers only.
Offensive-zone Deployment (x-axis)
Schultz didn’t play particularly tough minutes in regards to Zone Start%, with Mike Green being the only player in the chart who faced easier zone starts. Sometimes this can indicate that a coaching staff doesn’t trust a particular player to handle “tough” minutes, but that’s not the case here.
Schultz played 60.6 percent of the season paired with Green, who was often deployed in the offensive zone so he could advantage of his offensive talents. Schultz therefore faced relatively easy zone starts, but this is more a reflection of optimizing his partner rather than of a distrust by the coaching staff.
TOI Competition % (y-axis)
Schultz falls towards the upper middle of competition faced among Caps defenders during the 09-10 season. He finished fourth– right behind Joe Corvo, Tom Poti, and Green. Of the NHL’s 211 defenseman who played 410+ minutes during that season, Schultz finished 94th in terms of competition faced.
That means he didn’t face the league’s best competition, but he certainly wasn’t going up against plugs.
TOI per Game (bubble size)
It’s sometimes be hard to differentiate bubble sizes for different players. Schultz’s bubble is the second biggest on the team. Only Mike Green saw more 5-on-5 minutes. Schultz saw almost exactly 16 minutes of 5-on-5 play per game throughout the season. Of those same 211 defensemen across the league, this is the 84th highest. So, while Schultz wasn’t a workhorse relative to his counterparts around the league, he played an above average amount of time.
In terms of total minutes, Schultz averaged 19:52 per game, which was 117th out of the 211 defensemen. Schultz’s drop from 84th at 5-on-5 to 117th overall is due to his lack of special teams minutes. Schultz saw 17 minutes of total PP time during the season, which likely means he periodically hopped on at the tail end of a man advantage or got a little time during blowout. Schultz did see about 2 1/2 minutes per game on the PK, which was good for 78th among qualifying D.
So, in short, Schultz saw a slightly above average amount of minutes at 5-on-5, essentially no PP time and an above average amount of time on the PK. All of this resulted in Schultz’s total minutes being roughly average among NHL defensemen that season.
Possession (bubble shade)
The light blue shade to Schultz’s bubble indicates he was a positive relative possession player. In other words, the Caps saw a higher percentage of shot attempts in their favor when Schultz was on the ice compared to when he was on the bench.
Schultz’s shot-attempt percentage (Corsi For, or CF%) was 53.89 percent, aided by the Caps being a dominant possession team that year. Schultz’s relative shot-attempt differential, +1.43%, ranks third best among the nine Caps defenders in our chart. This was good for 65th among qualifying D.
PDO
PDO is not featured in the chart, but it’s highly relevant to this evaluation. PDO is one of the biggest factors driving plus-minus, if not the biggest. It’s the sum of on-ice save percentage and shooting percentage. It can be looked at on a team or individual level. This is a really nice tutorial on PDO.
Schultz’s PDO of 106.32 was the highest of all nine Caps defenders, finishing over 1.5 higher than the next player, Mike Green. Schultz’s PDO was not only 1st among Caps defenders, but 1st among all 211 NHL defensemen who played 410+ minutes during the season. This was almost an entire percentage point higher than the second place finisher, Mark Fistric, who came in at 105.38.
Since 2002, 6,608 skaters have played 400+ minutes in a single season. Schutlz’s 106.32 PDO is the 28th best among that group of 6,608. This is in the top 0.5 percentile. If Schultz’s PDO percentile happened to be his SAT percentile, he’d be going to Harvard on a full scholarship.
To further hammer home the point of just how lucky Jeff “Mr. Harvard of PDO” Schultz was, the Caps saw a plus-47 5-on-5 goal differential with him on the ice, despite seeing only a plus-95 shot differential. For the average player in the average season with a a plus-95 shot differential, we would expect to see plus-7 or plus-8 goal differential. plus-47 is staggering.
The Mike Green Effect
As noted above, Schultz played the bulk of his minutes paired with Mike Green. Schultz’s possession was 53.9 percent on the season. In the minutes he shared with Green, Schultz’s possession improved to 55.2 percent, as opposed to 51.9 percent he played away from Green.
Schultz saw a Goals For % above 70 percent in both situations, reflecting a monster PDO, but the 4-percent difference in possession with Green vs. without him was just another factor in Schultz’s plus-minus for the season. If you want further proof that Schultz was not a driver of possession, the three forwards he played with the most were Alex Ovechkin, Nick Backstrom, and Alex Semin, all of whom improved Schultz’s possession numbers when he shared the ice with them. All the minutes with the Caps “big three” forwards also had an impact on Schultz’s zone starts and competition discussed above
My purpose wasn’t to downplay Schultz’s season or debunk the validity of plus-minus. I think most hockey fans know by now that plus-minus doesn’t measure what we thought it did.
With this deeper look at a season often referenced by Caps fans, it’s fair to say Schultz was an above-average defenseman during the 2009-10 season. But more noteworthy is just how lucky he was. Jeff Schultz’s 2009-10 season was one the the luckiest of the past 12 seasons and, because of his borderline historical luck, he serves as our whipping boy of plus-minus and we can use a picture of him with a dog a lot more often than had he not been as lucky.


